
Note
Go to the end to download the full example code.
Get PHI Polarisation Maps#
This example demonstrates how to compute polarisation maps from the polarimetric (L2 Stokes) data from the Solar Orbiter PHI instrument.
Helper functions#
def check_stokes_dimensions(stokes):
    """
    Check if the Stokes parameter array has the correct dimensions.
    """
    shape = stokes.shape
    if shape[0] == 6 and shape[1] == 4: #wv,pol,y,x
        return stokes
    elif shape[2] == 4 and shape[3] == 6: #y,x,pol,wv
        print('Stokes file is in old format of (y,x,pol,wv)')
        print('Reshaping array to new format of (wv,pol,y,x)')
        stokes = stokes.transpose(3, 2, 0, 1)
        return stokes

def get_contpos(hdr):
    try:
        return hdr['CONTPOS']-1
    except KeyError:
        raise KeyError("Header does not contain 'CONTPOS' key, this may be because it is an older version of file.")

def get_cp(stokes, contpos = None, net = False):
    """
    compute circular polarisation map
    """
    I = stokes[:,0]
    V = stokes[:,3]

    # Avoid division by zero or negative intensity (clip very small I)
    eps = 1e-10
    I_safe = np.maximum(I, eps)
    a = [1,1,-1,-1]

    if net: norm = I_safe
    else: norm = np.ones_like(I_safe)

    CP = np.zeros(stokes.shape[-2:]) #map for each pixel

    if contpos == 0: wl = [1,2,4,5] #skip line core
    elif contpos == 5: wl = [0,1,3,4] #skip line core
    else: raise ValueError("Invalid contpos value. Use 0 or 5.")

    for n,i in enumerate(wl):
        CP += 0.25 * a[n] * (V[i]-V[contpos])/norm[i]

    return CP

def get_lp(stokes, contpos = None, net = False):
    """
    compute linear polarisation map
    """
    I = stokes[:,0]
    Q = stokes[:,1]
    U = stokes[:,2]

    # Avoid division by zero or negative intensity (clip very small I)
    eps = 1e-10
    I_safe = np.maximum(I, eps)

    if net: norm = I_safe
    else: norm = np.ones_like(I_safe)

    LP = np.zeros(stokes.shape[-2:]) #map for each pixel

    if contpos == 0: wl = [1,2,3,4,5] #include line core
    elif contpos == 5: wl = [0,1,2,3,4] #include line core
    else: raise ValueError("Invalid contpos value. Use 0 or 5.")

    for n,i in enumerate(wl):
        LP += 0.25 * np.sqrt((Q[i]-Q[contpos])**2 + (U[i]-U[contpos])**2)/norm[i]

    return LP

def get_tp(stokes, contpos = None, net = False):
    """
    compute total polarisation map
    """
    I = stokes[:,0]
    Q = stokes[:,1]
    U = stokes[:,2]
    V = stokes[:,3]

    # Avoid division by zero or negative intensity (clip very small I)
    eps = 1e-10
    I_safe = np.maximum(I, eps)

    if net: norm = I_safe
    else: norm = np.ones_like(I_safe)

    TP = np.zeros(stokes.shape[-2:]) #map for each pixel

    if contpos == 0: wl = [1,2,3,4,5] #include line core
    elif contpos == 5: wl = [0,1,2,3,4] #include line core
    else: raise ValueError("Invalid contpos value. Use 0 or 5.")

    for i in wl:
        TP += 0.25 * np.sqrt((Q[i]-Q[contpos])**2 + (U[i]-U[contpos])**2 + (V[i]-V[contpos])**2)/norm[i]

    return TP
Searching for PHI-HRT Stokes Data#
(Everything also applies to FDT data) We first search for Solar Orbiter PHI-HRT (High Resolution Telescope) Blos data in a given time range. The search results will return metadata about available files.
t_start_hrt = Time('2024-10-15T18:00', format='isot', scale='utc')
t_end_hrt = Time('2024-10-15T18:05', format='isot', scale='utc')

search_results_phi_hrt = Fido.search(a.Instrument('PHI'), a.Time(t_start_hrt.value, t_end_hrt.value), (a.soar.Product('phi-hrt-stokes')))
print(search_results_phi_hrt)
Results from 1 Provider:

1 Results from the SOARClient:

Instrument  Data product  Level        Start time               End time        Filesize          SOOP Name           Detector Wavelength
                                                                                 Mbyte
---------- -------------- ----- ----------------------- ----------------------- -------- ---------------------------- -------- ----------
       PHI phi-hrt-stokes    L2 2024-10-15 18:00:03.834 2024-10-15 18:01:26.596   308.52 L_BOTH_HRES_HCAD_Major-Flare      HRT   6173.341
sr_stokes = search_results_phi_hrt[0,0]
stokes_file = Fido.fetch(sr_stokes)
stokes = fits.getdata(stokes_file[0])
hdr = fits.getheader(stokes_file[0])
Files Downloaded:   0%|          | 0/1 [00:00<?, ?file/s]
Files Downloaded: 100%|██████████| 1/1 [00:00<00:00,  2.05file/s]
Files Downloaded: 100%|██████████| 1/1 [00:00<00:00,  2.04file/s]
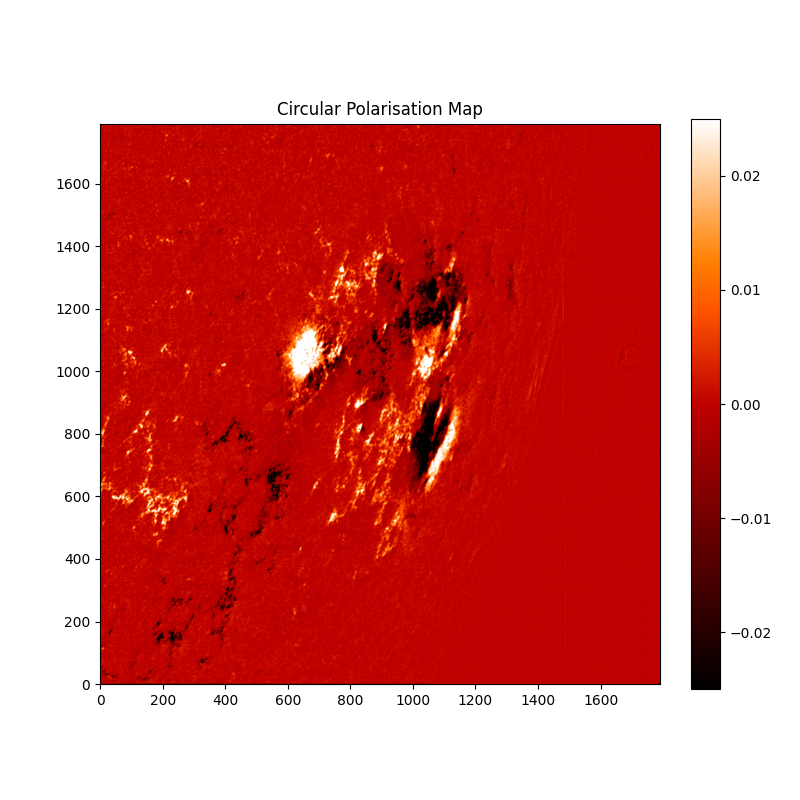
Circular Polarisation#
# net computes it using a normalisation factor of that pixel's (and that wavelength's) Stokes I
CP = get_cp(stokes, contpos = contpos, net = False)

plt.figure(figsize = (8, 8))
plt.imshow(CP, cmap = 'gist_heat', origin = "lower", vmin = -2.5e-2 ,vmax = 2.5e-2)
plt.colorbar(fraction=0.046)
plt.title('Circular Polarisation Map')
plt.show()
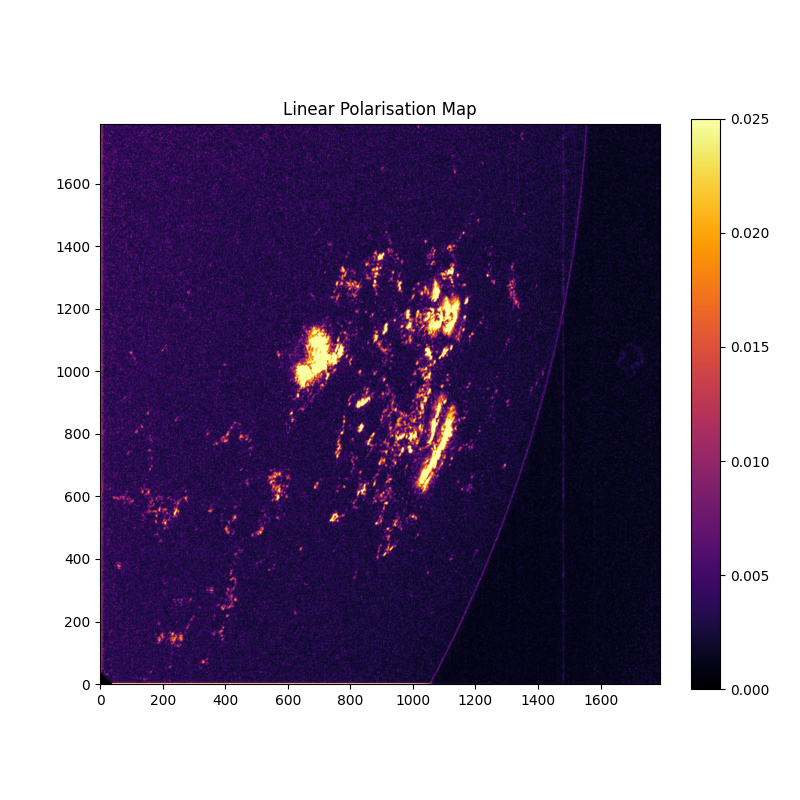
Linear Polarisation#
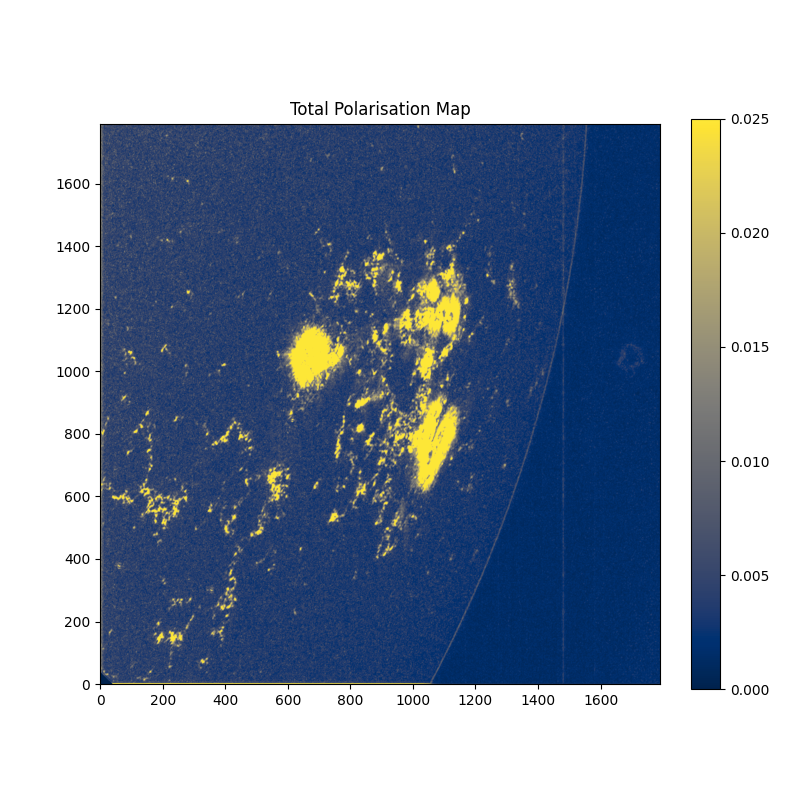
Total Polarisation#
Total running time of the script: (0 minutes 2.550 seconds)